Specialized Studies
Specialized Studies Services
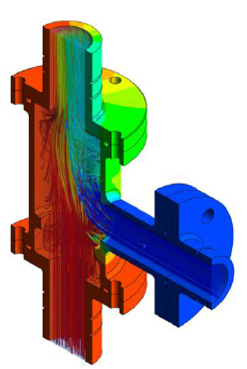
CFD Simulation In A Tee Pipe
Flow Assurance (Transient / Steady-State)
What is? And why we do?
Flow Assurance (FA) is an engineering analysis process that is used to ensure that hydrocarbon fluids are transmitted economically from the reservoir to production facility. The study includes steady state and transient analysis.
Flow in a pipeline is usually ‘steady’ with minimal interruptions. Maintaining production flow is critical to operators since abnormal operations occur when it becomes irregular and unpredictable. The analysis covers the evaluation of the problems caused by solids forming in pipeline and all risk associated with maintaining the flow.
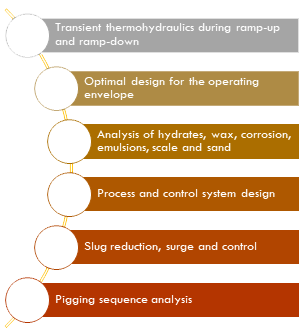
Approach
Physical data and actual/forecast thermohydraulic data of the system is transformed into a model in a software to replicate the actual system that can be used to create a new or modified flow assurance strategy. There are three types of flow assurance strategy that can be applied and considered:
- Prevention strategies that prevent issues from occurring.
- Remediation strategies by altering the PVT environment or chemical solution application as soon as any issues are detected.
- Optimisation strategies to improve production rates, ensure the operations is compliant with safety requirements and create an adaptable system that can handle challenges to the normal run of events.
The proper flow assurance assessment consists of: –
- The modelling of multiphase flows and temperature changes.
- The projection of hydrate, wax, asphaltene, scale and emulsion formation.
- The interface with other engineering departments and operational processes.
Software
- PIPESIM
- OLGA
Computational Fluid Dynamics (CFD)
What is CFD?
Computational Fluid Dynamics (CFD) is a simulations tools that use to analysts and predicts fluid phenomena (i.e. momentum, energy and mass transfer) numerically. Advancement of CFD allowed engineers to solve complex fluid problems i.e. Multiphase flow, Chemical reactions (combustion and reaction kinetics etc.), Separations etc.
Why we do?
In Oil & Gas and Chemical Processes industries, CFD is used as a “Virtual Experiment” to studies the fluid behaviour in process equipment (i.e. fluid manoeuvre, localize concentration, hotspot area etc.) in full three dimensional (3D) prior to full CAPEX investment.
CFD can be used for:
- Process understanding
- Equipment Retrofitting and Debottlenecking
- Design Optimization
- Conceptual Design
- Design Validation
IPS capabilities for CFD simulations includes the following:
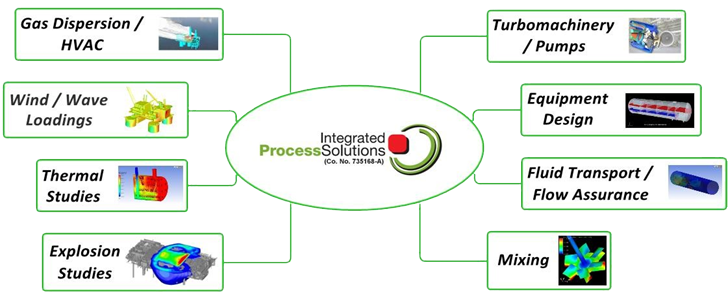
Possible analysis includes:
- Ventilation/ Natural convection
- Gas dispersion
- Explosion overpressures and blast wall optimisation
- Turbomachinery intake and exhaust system design
- Aerodynamic and hydrodynamic pressure loads
- Sloshing analysis due to wave loadings
- Thermal plume studies on offshore platforms
- Heat exchanger maldistribution and heat stresses
- Liquid-liquid or gas-liquid separation process
- Subsea pipeline flow regime prediction
- Pipeline sand impact assessment and erosion
- Chemical Injections
Software
- ANSYS
- FLACS
Consequence Modelling (2D and 3D)
What is Consequence Modelling?
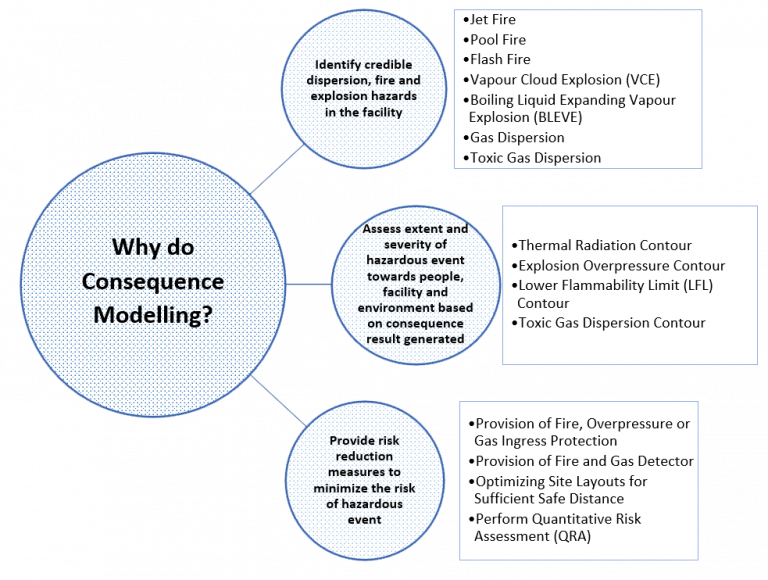
Consequence modelling demonstrates the impact of gas dispersion, fire and explosion accidents involving hazardous materials towards the people, facility and environment. Consequence modelling is performed after identifying credible dispersion, fire and explosion events in a facility. The modelling utilizes 2D or 3D simulation software to generate consequence result based on the impact criteria established in local or international standards.
Methodology
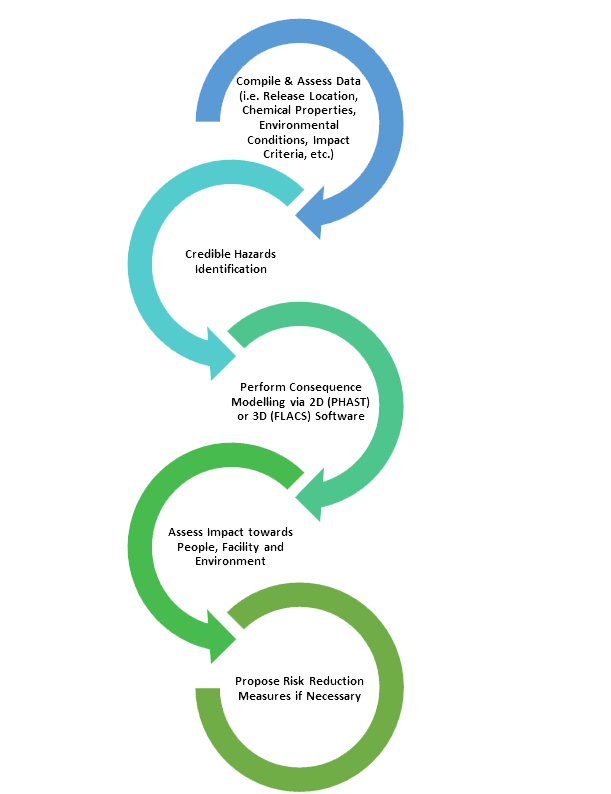
Consequence Modelling Preparation
The following documents are required for Consequence Modelling preparation:
- PFD and P&IDs
- Heat and Material Balance
- Design Basis Memorandum
- Process Design Basis
- Equipment Layout/ Plot Plan
- 3D Model
- Existing Operation HSE Case
Standards & Regulations
- OGP Risk Assessment Data Directory.
- CMPT, “A Guide to Quantitative Risk Assessment for Offshore Installations, John Spouge of DNV Technica, 1999.
- CPR14E, TNO Yellow Book, Methods for the Calculation of Physical Effects due to Release of Hazardous Materials (Liquids and Gases), 1997.
- UK HSE Technical Background Note on Assessment of Fire, Blast Barriers, Escape Routes and TRs.
- Control of Industrial Major Accident Hazards (CIMAH) Document.
- COMPANY’S Standards/ Guidelines.
Software
- DNV PHAST
- GEXCON FLACS
Fire and Gas Mapping
What is Fire and Gas Mapping?
When a facility is design with a fire and gas hazard in mind, one of the first system to be considered is Fire and Gas Detectors. These can vary from point type, Heat detectors, gas-specific detectors, smoke detectors, fusible plugs and etc. For initial review when plant layout is produced, the designs will address this detector more qualitatively then quantitatively based on its hazard type area and supposed “how big or small” the gas/fire will be. This is usually done in a more conservative manner as there is a lot at stake if there is to little, but even then not all areas are well defined unless the design is seen in a 3D view.
F&G Mapping Study fulfil this gap by assessing the 3D design of a facility and optimizes the initial design of F&G detectors by taking actual coverage of the F&G Detectors and Appling it against the design and its potential hazard coverage.
Why Do Fire and Gas Mapping?
3D Fire and gas Mapping supports the design technique and optimises the number of detectors required to meet coverage targets. F&G Mapping permits the designer to position flame and gas detection devices at intervals the facility and assess the coverage afforded by the system. This can be mechanically correlative against pre-specified targets that the system should achieve. F&G Mapping provides designers with the methodology and tools to review detection coverage against pre-determined targets and guarantee an appropriate and optimized system is commissioned.
A 3D simulation software (e.g. Detect 3D) is usually used to perform this F&G mapping study take into account the obstruction of equipment, structure. A F&G mapping study is especially supported by the comparison of detector coverage versus the coverage target.
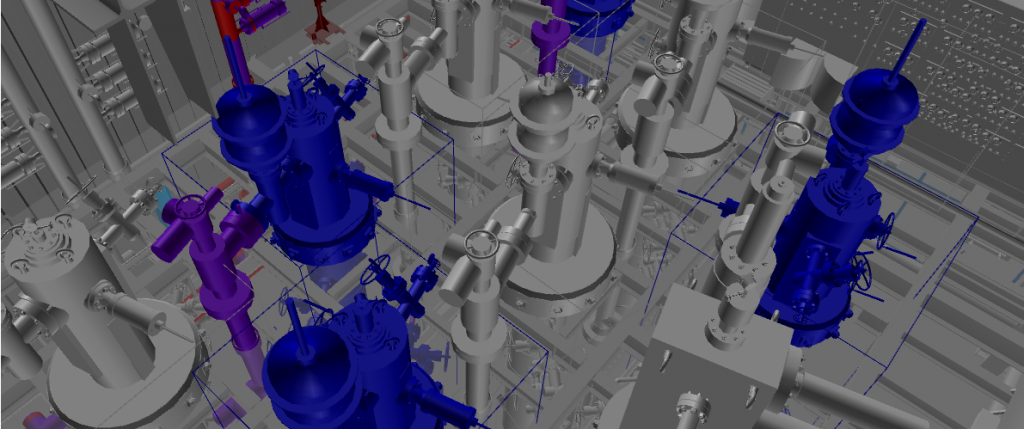
Study can be applied to
- New design (FEED or DED) to optimize the coverage during design stage.
- Modification work when newly installed unit/section/package needs to be covered by existing or additional detectors.
- Existing operational facility – to optimize the coverage with updated data on-site or if it was never done prior to its previous design.
Study reference Includes
- API 14C Recommended Practice for Analysis, Design, Installation, and Testing of Basic Surface Safety Systems for Offshore Production Platforms
- ISA TR-84.00.07 Guidance on the evaluation of Fire, Combustible Gas and Toxic Gas System Effectiveness
- Petronas Technical Standard (PTS 14.33.01 and PTS 14.12.07)
Flare and Vent Studies
Deflagration and Detonation Studies
The primary design intent of a vent system is to safely dispose pressure relief and blowdown gas to atmosphere in a manner that protects platform personnel and facilities from the gas dispersion, and potential heat radiation and liquid carry over to vent. However due to several unintended scenarios, flame flashback could occur and may lead to explosion.
Flame flashback is defined as reverse flame propagation from vent tip to upstream process facility, in the event of unintended vent ignition.
Once a vent tip is ignited and flame begins to flash back into upstream confined piping system, several potential scenarios may occur (in the event suitable flashback protection is not provided):
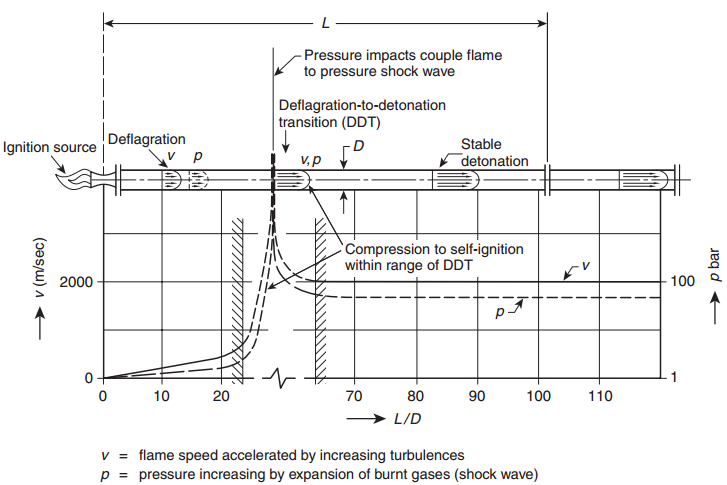

Why we do?
Due to the significant difference between deflagrations and detonations, and the potential explosion impact to the system, therefore, it is of critical importance to understand at what point a deflagration becomes a detonation and the extend of the consequences. There is clear evidence that as flames propagate in piping they will develop from deflagrations to detonations, DDT (especially for gases).
Approach
Typical assessment and approach for the study:
- Review on the likelihood of ignition and flame flashback to occur
- Review on the likelihood of deflagration and/or detonation
- Review on the maximum explosion pressure that could be experienced by the vent system. This could be done via qualitative analysis or 3D simulation
- Review adequacy/requirement of flashback protection, e.g., liquid seal drum, molecular (purge gas) seal, fluidic seals, flame arrester, etc. Provision of recommendations to improve current flashback protection design if necessary
Standards / References
- API RP 2028 Flame Arresters in Piping Systems.
- API RP 2201 Flame Arresters for Vents of Tanks Storing Petroleum Products.
- NFPA 69 Standard on Explosion Prevention Systems.
Software
FLACS
ANSYS Fluent
Acoustic / Flow Induced Vibration (AIV/FIV) Study
Acoustic-Induced Vibration
Acoustic-induced vibration (AIV) is a structural vibration in a piping system that caused by high level of acoustic energy generated from pressure reducing devices such as pressure relief valve, blow down valve, and flow/pressure control valves. This study is recommended where pressure reducing valves are located.
Pressure reducing devices can generate high acoustic energy that excite the pipe shell vibration (circumferential pipe) modes. This AIV leads to fatigue failure in the process piping or nearby small-bore connections and generates broadband sound radiation in the range of 500 – 2000Hz. Unless controlled, AIV may result in catastrophic piping failures. The internal acoustic energy can also create external noise that may affect operator’s safety (hearing loss).
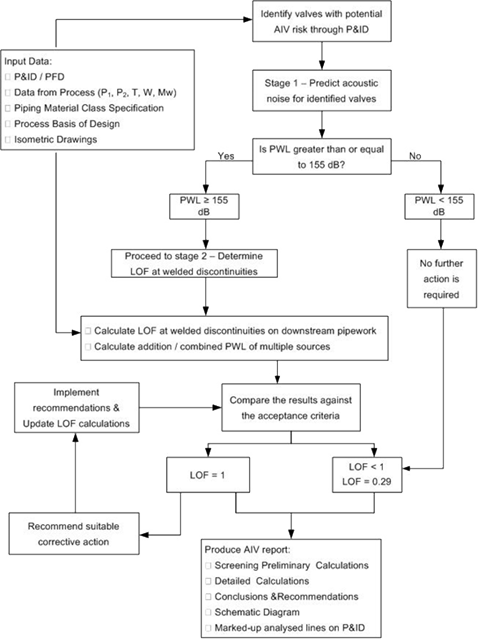
Figure below shows the flow chart and methodology summary in conducting the AIV study:
Flow Induced Vibration (FIV)
Flow–induced vibration (FIV) or vortex shedding is due to high flow velocities such as in piping dead leg of a centrifugal compressor system that cause the pipe to vibrate. The high flow velocities can either be cyclical/periodical in nature or of a random / turbulent nature. Turbulence is generally exists within any piping system, where the major source of turbulence is due to obstructions or direction changes in the system (i.e. elbows, tees, valves, or expanders). These turbulences can generate high levels of energy which can cause vibration in both piping and piping restraints.
This study evaluates vortex shedding and potential vibrations across fatigue sensitive locations including branch connections (especially small bores), elbows and bends, restraints and supports, and welded joints associated with main lines. The scope for FIV assessment can be plant wide or at specific locations. The typical lines to be analyzed are as follows:
- Main process lines
- Recycle lines
- Lines containing flow restrictions/valves
- High density gas lines
- Lines with high flow velocity
- Lines containing small bore fittings, thermal wells, and sample probes
Figure below shows the flowchart and methodology summary used in conducting FIV assessment:
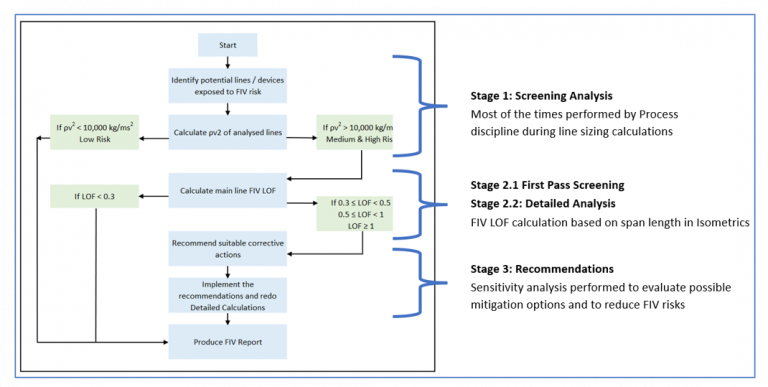
Both AIV and FIV assessments refer to the Energy Institute’s (EI) Guidelines for the Avoidance of Vibration Induced Fatigue Failure in Process Pipework (2nd edition), January 2008.
Noise Study
What is Noise Study?
Noise Study or also known as Noise Mapping is a map of an area which is coloured according to the noise levels in the area. Sometimes, the noise levels may be shown by contour lines which show the boundaries between different noise levels in an area. The noise levels over an area will be varying all the time.
Why Do Noise Study?
A benefit of having a noise model is that it can be used to assess the effects of high noise level on equipment on peoples. Thus the effect of a proposed new installed equipment can be assessed and suitable noise mitigation can be designed to minimise its impact. This is particularly important in noise action planning, where a cost-benefit analysis of various options can be tested before a decision is made.
Corrosion Studies
Corrosion Design Basis Memorandum (CDBM)
Corrosion Design Basis Memorandum (CDBM) provides a basis for the corrosion assessment and review material selection report for process equipment including piping. We often develop CDBM during FEED stage or preferably as early as during conceptual design stage and continuously reviewed until the construction stage.
Why we do?
The main objectives of CDBM are:
- To identify the potential threat and damage mechanism by performing corrosion assessment on the equipment and associated piping.
- To evaluate potential material or integrity issues.
- To provide practical recommendations where required to mitigate these issues, i.e., including the corrosion control and monitoring where applicable.
- To ensure the constructed asset can be safely and reliably operated throughout the design life.
Approach
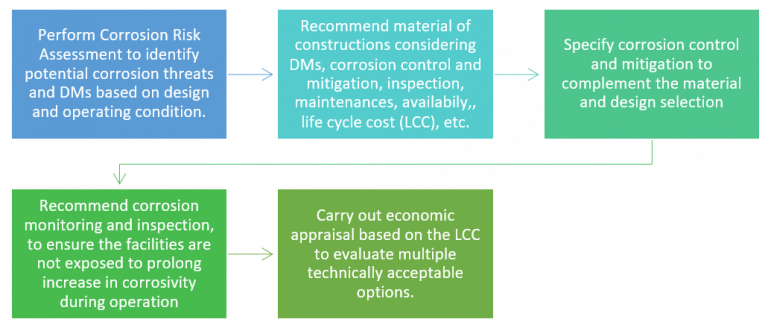
Typical activity in CDBM development process is as shown below:
Standards / References
- API 571 Damage Mechanisms Affecting Fixed Equipment in the Refining Industry
- ISO 15663 Petroleum, Petrochemical and Natural Gas Industries — Life Cycle Costing
- ISO 21457 Materials Selection and Corrosion Control for Oil and Gas Production Systems
- PTS 12.30.01 Piping Classes – Basis of Design
- PTS 15.04.01 Corrosion Management
- PTS 12.30.02 Piping General Requirements
- PTS 12.34.02 Glass-Fibre Reinforced Plastic Piping System
- PTS 11.15.02 Onshore Steel Structures
- API 581 Risk Based Inspection
- ASME B31.3 Process piping
- Norsok M-001 Material Selection threat
Software
- ECE 5
- Hydrocorr
Reliability, Availability and Maintainability (RAM)
What Is?
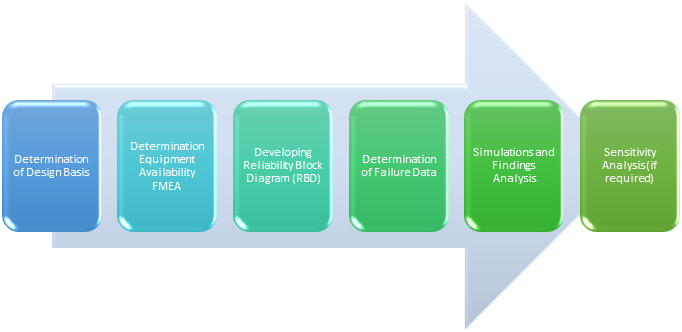
The RAM study (Reliability, Availability, and Maintainability) is an organised and quantitative approach to asset optimization that uses the Monte-Carlo principle to dramatically reduce project costs. The goal of RAM modelling and simulation is to identify all potential sources of production losses and provide the optimum system options. It is based on the Monte-Carlo principle and is a probabilistic technique. As a result, the RAM study is a tool for making decisions and optimising the system by changing certain design or logistic characteristics to attain maximum cost-efficiency.
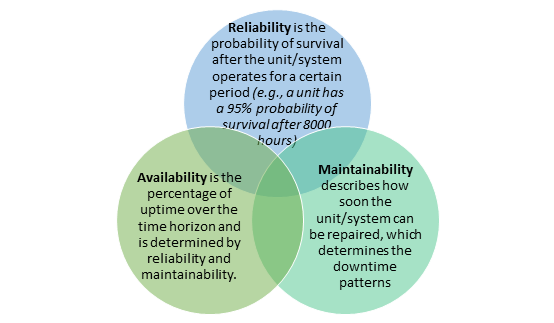
The diagram depicts the link and definition of Reliability (R), Availability (A), and Maintainability (M). It is evident from the figure and description that when these parameters are factored into the system’s design and operation, it will operate optimally. As a consequence of a thorough RAM analysis, the system’s utmost capability as designed will be realised. Consequently, a better decision for productivity, services utilization, maintenance and functioning of equipment are implemented.
Approach
Codes and Standards
- BS 5760-2:1994
- BS EN ISO 20815:2010
- ISO 14224:2016
- ISO/TR 12489:2013
- IEC 61078:2016
- BS 5760-2:1994 Reliability of systems, equipment and components. Guide to the assessment of reliability
- BS EN ISO 20815:2010 Petroleum, petrochemical and natural gas industries — Production assurance and reliability management
- ISO 14224:2016 Petroleum, petrochemical and natural gas industries — Collection and exchange of reliability and maintenance data for equipment
- ISO/TR 12489:2013 Petroleum, petrochemical and natural gas industries — Reliability modelling and calculation of safety systems
- IEC 61078:2016 Reliability block diagrams
Software
- DNV GL MAROS
- DNV GL TARO
Carbon Footprint Assessment / Green House Gas Study
What is Carbon Footprint Assessment?
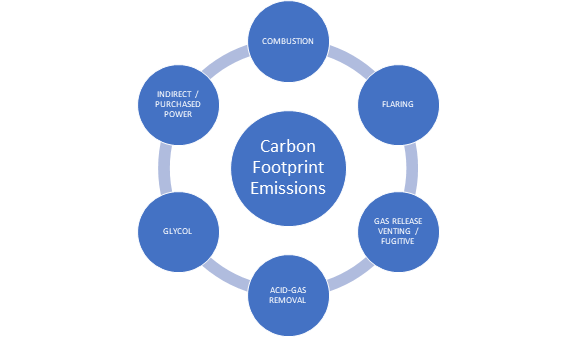
Over the course of a plant operation, multiple point within a facility where gas fume is release, exhaust gas produce, fuel burning for various reason and even unavoidable release of other gas. Gas such as CO2, Methane, Nitrous oxide and Fluorocarbons have a global warming potential as are thus classified as Green House Gas (GHG).
Carbon footprint assessment or Greenhouse Gas (GHG) Study looks into the potential carbon emission of facility will contribute to the environment. Although carbon footprint can be derived from production of asset/item/ACTIVITY, this study focuses on OPERATIONAL impact of the facility. This includes power generation, vent release, flaring, burning fuel (i.e. alternative power or boiler) and other significant carbon producing activity that is related to the operation of the facility.
Why do Carbon Footprint Assessment?
Study is performed within company to assess a facility potential GHG impact over the course of its operation lifecycle referred to as CO2e (CO2 equivalent of GHG impact). The result can be used to analyse a comparative between carbon reducing method as it can also include a cost analysis (capital/ operational) and potential carbon reduction it provides (i.e. excess gas being used for flaring vs venting vs re-cycle for fuel). The study can also be used for estimating the carbon tax (if applicable) compared with benefit/cost of carbon reducing strategy.
Standards / References
- Petronas Technical Standard (PTS 18.72.05), Greenhouse Gas Monitoring, Reporting and verification
- API Compendium of Greenhouse Gas Emissions Methodologies for The Oil and Natural Gas Industry
- World Resources Institute, Corporate Accounting and Reporting Standard, World Business Council for Sustainable Development
- IPIECA, Petroleum Industry Guidelines for Reporting Greenhouse Gas Emissions
